I performed a BCI Competition challenge to create a ternary classifier for motor imagery data.
I explored various algorithms for dimensionality reduction and machine learning, ultimately employing Principal Component Analysis (PCA) for feature selection and a coarse Gaussian Support Vector Machine (SVM) with Error Correcting Output Codes (ECOC) as a supervised learning model to distinguish between left motor imagery, right motor imagery, and word association with as high as 73% accuracy.
BCI Competition III Dataset V provided both training and testing pre-processed datasets, in which 32-channel time series were transformed into 96-dimensional feature spaces. The resulting datasets included power spectral density values for frequencies in alpha and beta bandwidths (8-30 Hertz) along 8 centroparietal channels (C3, Cz, C4, CP1, CP2, P3, Pz, and P4).
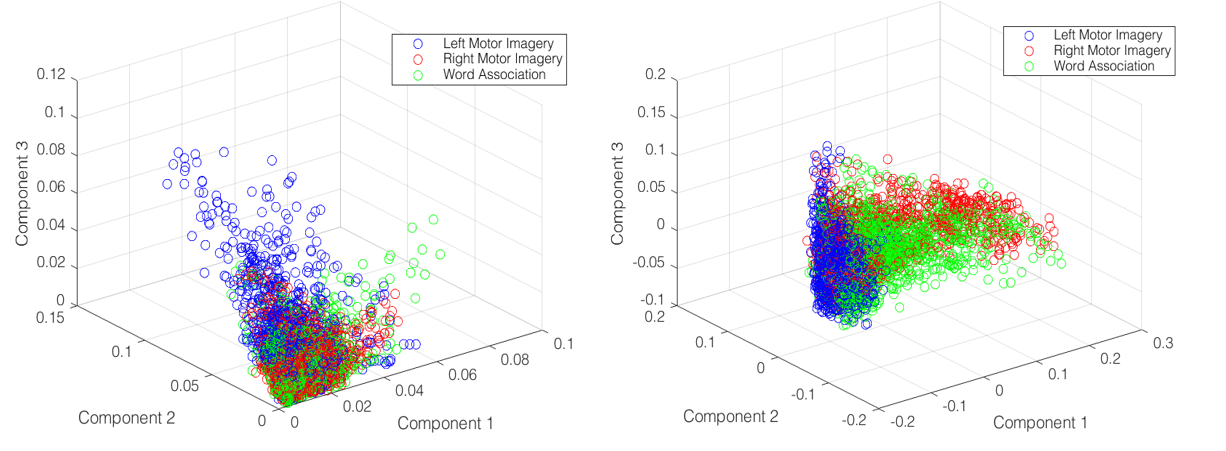
To capture the data’s overall behavior while reducing the dimensionality of the problem, I selected the five components which accounted for maximum data variance using MATLAB’s Principal Component Analysis function. As shown below, this process reduces noisy behavior and physically distinguishes multiclass data.
Once this transformation was complete, I applied Support Vector Machines (SVMs) in order to maximize the margin between two distinct classes. Due to the nonlinear nature of the data, I used a radial basis function (RBF) kernel for calculating the squared Euclidean distance between two vectors, thus placing greater weight on objects that are farther apart.
Since SVM only performs binary classification, I additionally employed an Error Correcting Output Codes (ECOC) multiclass model. This process breaks an n-ary classification into n(n – 1)/2 binary SVM learners. Using one versus one coding, I generated three hyperplanes to distinguish Class 1/Class 2, Class 2/Class 3, and Class 1/Class 3, respectively.
The figure below shows a sample hyperplane generated using SVM to distinguish between instances of left and right motor imagery.
Applying the model to testing data maps it into the aforementioned feature space. Here, distinguishing where the data lies with respect to the training hyperplanes provides a prediction as to its class.
The BCI Competition provided three training and one testing dataset for each of its three subjects. The competition deliverable was a set of class predictions for the testing dataset. Once submitted, teams would receive results about their accuracy. In order to test accuracies more freely, I performed intermediate tests of the model by training on two of the training datasets, testing on the third, and calculating the model’s accuracy. The system reported as high as 73.5% accuracy under this schema, with an average classification rate of 68.47%.
Additional efforts to improve the model resulted in overfitting. I experimented with methods of tuning the SVM model, such as using a Bayes Optimizer to determine kernel fineness and PCA component selection to explain up to 95% of the data variance. While these efforts improved model fitness on the training sets, it resulted in poorer classification on novel data. Thus, a coarse approach for signal analysis was kept for the highest, albeit non-optimal classification performance.