Project Summary:
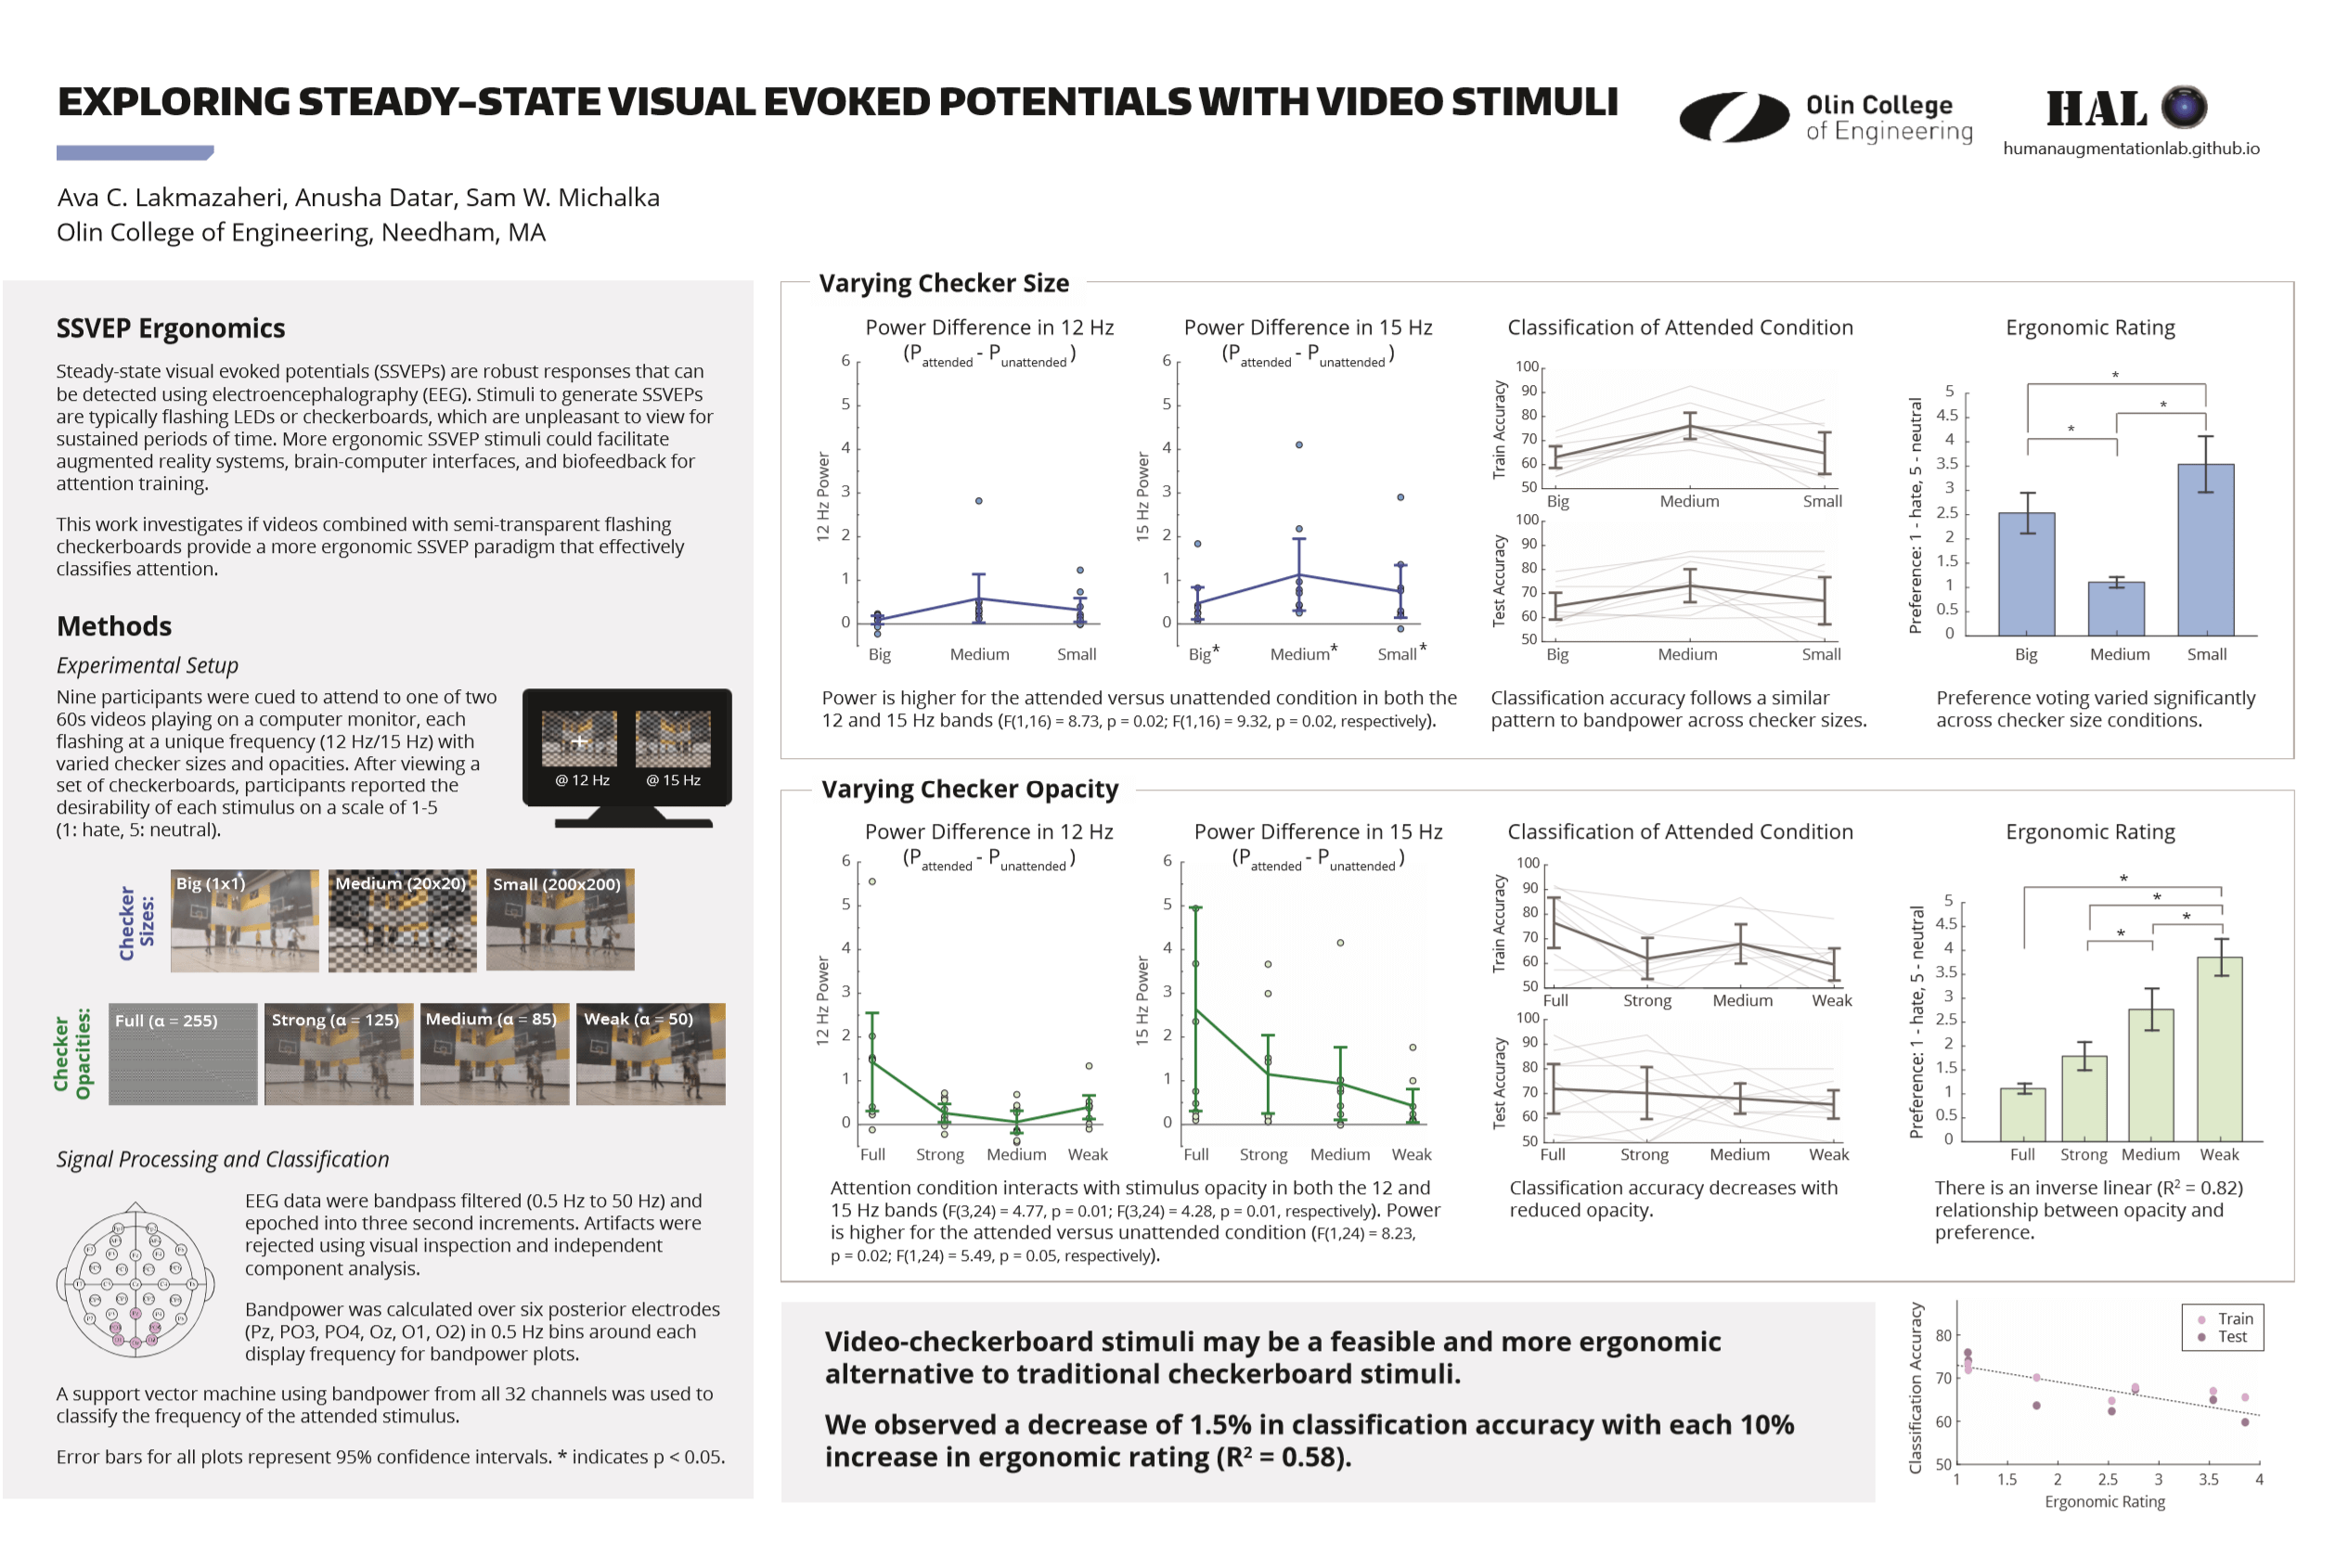
The Human Augmentation Lab’s first long-term study investigated the use of a novel checkerboard-video stimulus for steady state visual evoked potentials (SSVEP) with the dual purpose of 1) creating more ergonomic brain-computer interfacing controls and 2) studying attention in a more natural form.
For real-world control applications, brain-computer interfacing (BCI) systems must provide both robust performance and ease of user interaction. BCI systems based on SSVEP have gained popularity due to the signal’s high signal-to-noise ratio (SNR) using electroencephalography (EEG) without requiring extensive user training. However, traditional SSVEP stimuli - flashing lights or flashing black and white checkerboards - can be uninteresting or unpleasant to view for sustained periods of time. Efforts to produce more natural and ergonomic SSVEP stimuli while preserving SNR have peaked in recent years to address both needs of modern BCI.
We aimed to quantify the trade-off between stimulus ergonomics and signal robustness for more natural SSVEP stimuli. We tested if videos could be combined with semi-transparent flashing checkerboards, varying both checker size and opacity, to effectively classify which stimulus a person was attending to. We were able to classify attention location with >70% accuracy across sixteen subjects, suggesting that video-checkerboard stimuli are a feasible alternative to traditional checkerboard stimuli for SSVEP studies.
I presented our work at the Society for Neuroscience’s 2019 annual meeting in Chicago, IL (see poster below). Our corresponding research paper is in progress and will be submitted for peer review later this year.
Project Details:
In 2017, a major undertaking of the newly formed Human Augmentation Lab was to validate our medical-grade EEG equipment and begin piloting experiments.
Experimental Design:
We recorded EEG signals from sixteen participants using the Neuroelectrics Enobio with 32 electrodes placed according to the International 10-20 System. Participants viewed two videos playing simultaneously. To minimize variability due to hemispheric effects, we cued them to attend to the left video using a fixation cross placed in the center of the stimulus.
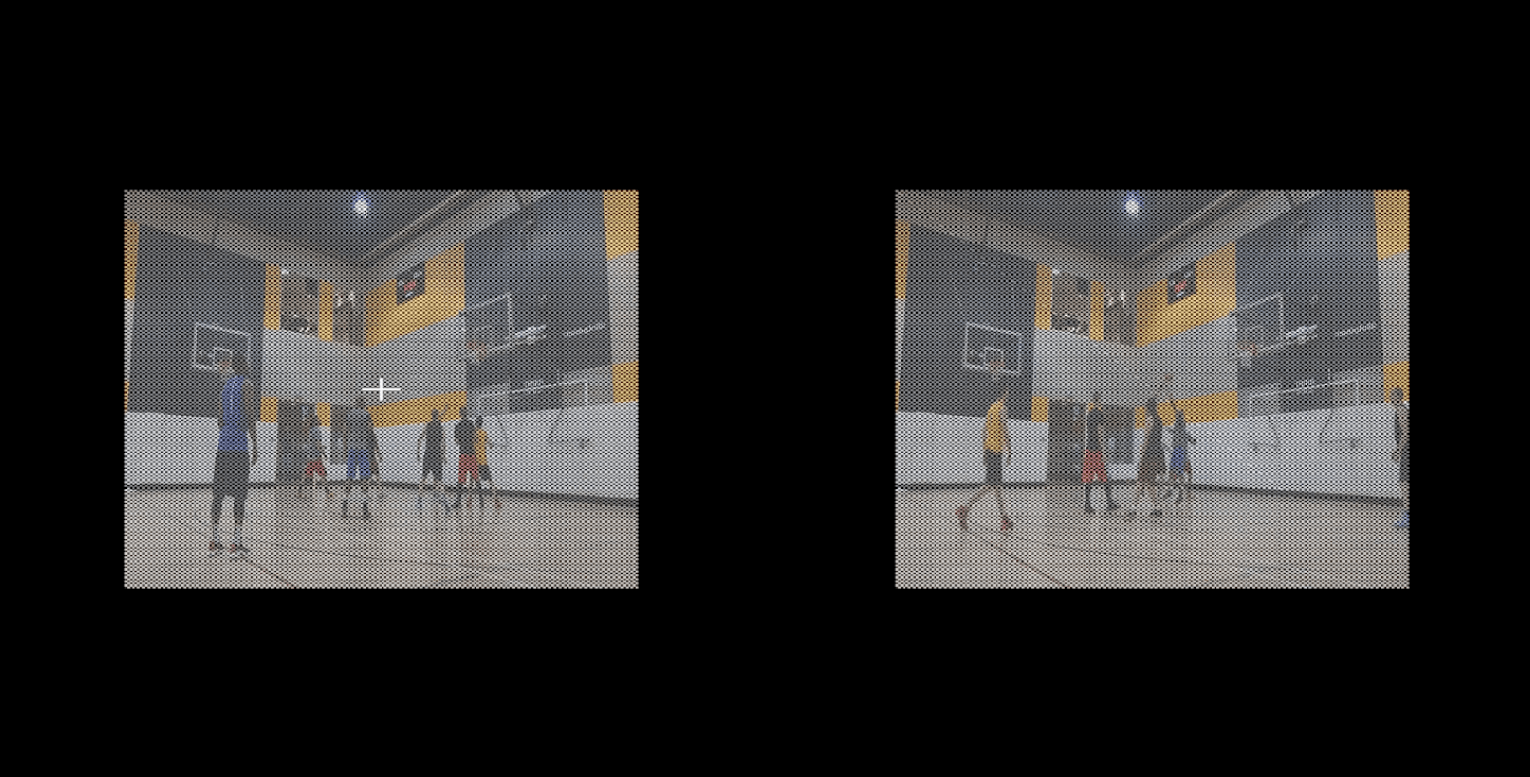
We overlaid a black-white square checkerboard over each video, with each checkerboard flashing at a unique frequency (either 12 Hz or 15 Hz). Over each trial, we varied configurations of checker size and checkerboard opacity. The three checker size conditions were small (200 x 200 grid), medium (20 x 20 grid), and big (1 x 1 grid). The four opacity conditions were full (α = 255), strong (α = 125), medium (α = 85), and weak (α = 50).
After each video, participants self-reported their own level of attention to the video on a scale of 1 to 4 and then took a short self-paced break. Following each run, participants reported the desirability of each visual stimulus on a scale of 1 to 5 and then took a longer break before the next run.
Data Analysis:
We pre-processed the collected data by bandpass filtering (0.5 Hz to 50 Hz), epoching into three second periods, and then rejecting artifacts using visual inspection and independent component analysis.
We calculated bandpower for six posterior electrodes (Pz, PO3, PO4, Oz, O1, O2) in 0.5 Hz bins around each display frequency (i.e., 11.75 to 12.25 Hz and 14.75 to 15.25 Hz). We calculated an average power value in each bin by weighing the six electrodes equally.
We ran one N-way ANOVA on the opacity experiment and a second ANOVA on the combined data from the two checker size experiments. The checker size experiments were combined because the opacity difference between these two data sets was determined not to be statistically significant.
For our classification framework, we placed 80% of the preprocessed and epoched data into the training set and 20% of the data into the test set. For all of the data in the training set, we calculated the bandpower for all 32 channels with frequency bins placed at 11.75 Hz to 12.25 Hz and 14.75 Hz to 15.25 Hz. We used the log of these bandpower values as a set of features for MATLAB’s SVM function with 5-fold cross-validation. The classifier used the ‘expected-improvement-plus’ acquisition function and excluded 5% of the total dataset as potential outliers.